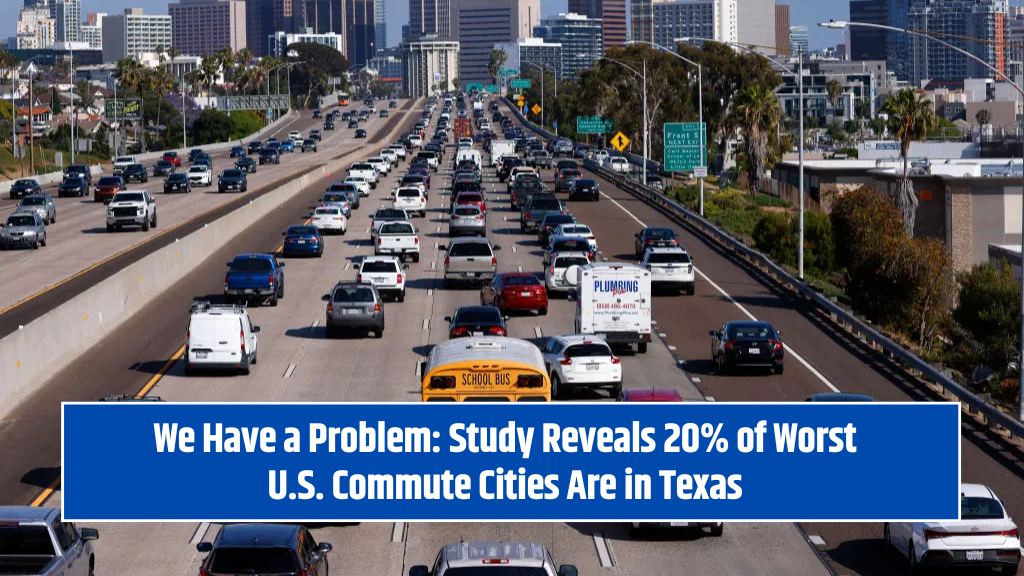
Long commutes aren’t just inconvenient—they’re costly. From time lost to higher fuel expenses, lengthy daily drives can impact your well-being, wallet, and work-life balance. Based on U.S. Census Bureau estimates, SmartAsset has identified the cities with the worst commutes in the U.S., and two of them are right in Texas.
Using six key metrics—including commute length, cost, and growth over five years—these cities top the list for commuters who are spending far too much time and money just getting to work.
The 10 Worst U.S. Cities for Commuters
1. Stockton, California
Average commute: 33 minutes
Commutes over 60 mins: 17% (2nd highest overall)
Commute growth (2016–2021): +6.21%
Located about 90 minutes from San Francisco, Stockton workers endure the worst overall commute in the nation. A significant number travel long distances daily, and commute times are rising.
2. Bakersfield, California
Average commute: 24 minutes
Commute growth: +10.5% (highest increase in study)
Traffic in Bakersfield has worsened more than anywhere else in the past five years. This city is quickly climbing the ranks for frustrating commutes.
3. Garland, Texas
Average commute: 30 minutes
% of workers commuting: 86.1%
Commute over 60 mins: 9.1%
Located in the Dallas metro area, Garland combines long drives with one of the highest percentages of commuting workers in the country.
4. Glendale, Arizona
Average commute: 28 minutes
Commute over 60 mins: ~10%
One in ten workers in Glendale spends over an hour getting to work, which puts this Phoenix suburb high on the list of frustrating commutes.
5. Orlando, Florida
Average commute: 26 minutes
% of workers commuting: 80%+
Commute over 60 mins: Under 5%
Famous for its theme parks, Orlando also brings heavy congestion, especially during tourist seasons. Thankfully, fewer workers have hour-long commutes here compared to other cities on this list.
6. Las Vegas, Nevada
Average commute: 25.7 minutes
% of workers commuting: 87%
Commute growth: +0.8%
Though the commute time is manageable, Las Vegas’s increasing number of long-haul commuters adds pressure to local roads, especially in a city already busy with tourism traffic.
7. El Paso, Texas
% of workers commuting: 89.9%
% of income spent on transport: 14.13%
While commute times aren’t the longest, transportation costs are among the highest, taking a big chunk out of household budgets.
8. Baton Rouge, Louisiana
Average commute: ~23 minutes
% of workers commuting: 90.2%
Commute over 60 mins: 6%
Transport costs: 12.24% of income
With a high share of commuters and steep transportation costs, Baton Rouge resBidents pay more for less time behind the wheel—and that’s still too much.
9. Aurora, Colorado
Average commute: 28.5 minutes
Commute over 60 mins: 6.8%
Just outside of Denver, Aurora’s lower housing costs come with a trade-off: longer drives and increasing traffic congestion.
10. Winston-Salem, North Carolina
Average commute: 21.6 minutes
% of workers commuting: 85%
Transport costs: 12.63% of income
Commute growth: +6%
Don’t let the shorter commute time fool you—rising travel times and high transport costs make Winston-Salem a surprising addition to this list.
Commute times and transportation costs may not always be top-of-mind when choosing where to live—but they should be. Longer commutes mean more time away from family, higher gas bills, and added stress. If you’re considering relocating for work or retirement, take a good look at commute statistics and transportation infrastructure before making a decision.
While major cities often provide more job opportunities, they also come with heavier traffic and higher commuter expenses. Understanding how these factors play out in different cities can help you plan better for your daily routine—and your wallet.

