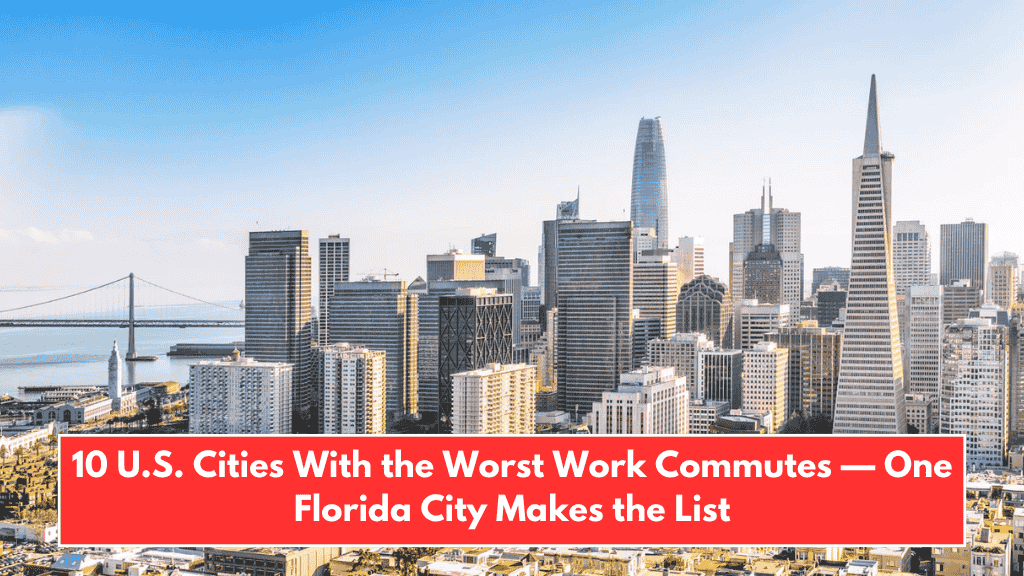
As more people return to offices post-pandemic, traffic congestion is once again becoming a daily headache. In some American cities, commuting to work is not just a short drive — it’s a daily challenge that eats up time, energy, and even money.
According to a recent study by SmartAsset, some workers now spend up to 222 hours per year just getting to and from their jobs. Using data from the U.S. Census Bureau, the study ranked the 10 cities with the worst commutes in the country.
How the Study Was Done
SmartAsset examined the 100 largest U.S. cities using six important metrics:
- Percentage of workers who commute
- Average time spent commuting
- Change in commute time over 5 years
- Percentage of workers commuting for over 60 minutes
- Growth in long commutes (over 5 years)
- Cost of transportation as a percentage of income
Let’s take a look at the cities that made the list and what makes their commutes especially frustrating.
1. Stockton, California
- Average Commute: 33 minutes
- Over 1-Hour Commutes: 17.2%
- Commute Time Increase (2016–2021): 6.21%
Located about 90 minutes from San Francisco, Stockton tops the list. With over 17% of its workforce commuting more than an hour, workers here face serious travel delays.
2. Bakersfield, California
- Average Commute: 24 minutes
- Commute Time Increase: 10.5% (highest in the study)
Bakersfield may not have the longest travel time, but the sharp increase in traffic over the years has made it a top offender. It has the highest five-year jump in average commute time.
3. Garland, Texas
- Average Commute: 30 minutes
- Long Commutes Over 1 Hour: 9.1%
- Commute Time Growth: 2.37%
Garland has a high percentage of commuters — 86.1% of workers travel to jobs — which means more traffic and delays are likely.
4. Glendale, Arizona
- Average Commute: 28 minutes
- 1-Hour+ Commutes: Nearly 10%
Glendale ranks high due to a large number of long commutes. If you dread being stuck in traffic, this Arizona city might test your patience.
5. Orlando, Florida
- Average Commute: 26 minutes
- 1-Hour+ Commutes: Less than 5%
- Commuters: 80% of workers
Orlando is known for theme parks, but workers face high traffic levels, especially due to tourism. Though the percentage of extremely long commutes is lower, the daily rush still slows people down.
6. Las Vegas, Nevada
- Average Commute: 25.7 minutes
- 1-Hour+ Commutes: 5%
- Commuters: 87%
- Commute Time Growth: +0.8%
Las Vegas isn’t just about casinos — it’s also home to some of the busiest roads in the country. Many residents spend nearly 30 minutes a day just getting to work.
7. El Paso, Texas
- Commuters: 89.9% of workers
- Transport Cost: 14.13% of income
El Paso’s commuting problem is less about time and more about cost. Almost 14% of household income goes into transportation, which makes commuting financially stressful.
8. Baton Rouge, Louisiana
- Average Commute: 23 minutes
- 1-Hour+ Commutes: 6%
- Commuters: 90.2%
- Transport Cost: 12.24% of income
Even though the average commute isn’t long, the high percentage of commuters and transportation costs place Baton Rouge on this list.
9. Aurora, Colorado
- Average Commute: 28.5 minutes
- 1-Hour+ Commutes: 6.8%
Aurora is a popular alternative to nearby Denver due to lower housing costs. But this comes with a price — longer commutes for many workers.
10. Winston-Salem, North Carolina
- Average Commute: 21.6 minutes
- Commute Time Increase: 6%
- Transport Cost: 12.63% of income
- Commuters: 85%
Winston-Salem rounds off the list with moderate commute times, but rising transportation costs and increased travel time put pressure on its workers.
While commuting is a part of working life, some cities make it far more tiring than others. With rising travel times and high transport costs, places like Stockton, Bakersfield, and Orlando are becoming more challenging for daily commuters.
If you’re considering moving to one of these cities, it’s important to factor in not just housing costs, but also how much time and money you’ll spend commuting every day.